
An object diagram is a graph of instances,including objects and data values.A static object diagram is an instance of a class diagram .It shows a snapshot of the detailed state of a system at a point in time.

Difference between class and object diagram
A class diagram may also
contain interfaces, packages, relationships, and even instances, Object
diagram on the other
hand is a graph of instances, including objects and data
values. A static object diagram is an instance of a class diagram.
Purpose
of Object Diagram
The
use of object diagrams is fairly limited, mainly to show examples of data
structures.
- During
the analysis phase of a project, you might create a class diagram to
describe the structure of a system and then create a set of object
diagrams as test cases to verify the accuracy and completeness of the
class diagram.
- Before
you create a class diagram, you might create an object diagram to discover
facts about specific model elements and their links, or to illustrate
specific examples of the classifiers that are required.
Basic
Object Diagram Symbols and Notations
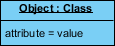
Object Names:

|
|
Object Attributes:
|
|
Links:

|

The following diagram is an example of an object diagram. It
represents the Order management system .The following diagram is an instance of
the system at a particular time of purchase. It has the following objects.
·
Customer
·
SpecialOrder
Now the customer
object (C) is associated with three order objects (O1, O2, and O3). These order
objects are associated with special order and normal order objects (S1, S2, and
N1). The customer has the following three orders with different numbers (45, 60
and 80) for the particular time considered.
The same is true
for special order and normal order objects which have number of orders as 20,
30, and 60. If a different time of purchase is considered, then these values
will change accordingly.
You don't realize how quickly technology is changing. Data science is highly technical and is therefore in high demand. A career in data science will open up many lucrative job opportunities. So, if you have been wanting to start your career in Data Science, now is the best time to enroll in a data science program with one of the best data science training institute in noida.
ReplyDelete